NMRPredict Help
| Help overview | ||
| Running a Prediction | ||
| C13 NMR Prediction in Detail | ||
| Proton NMR Prediction in Detail |
Inspecting Prediction Results
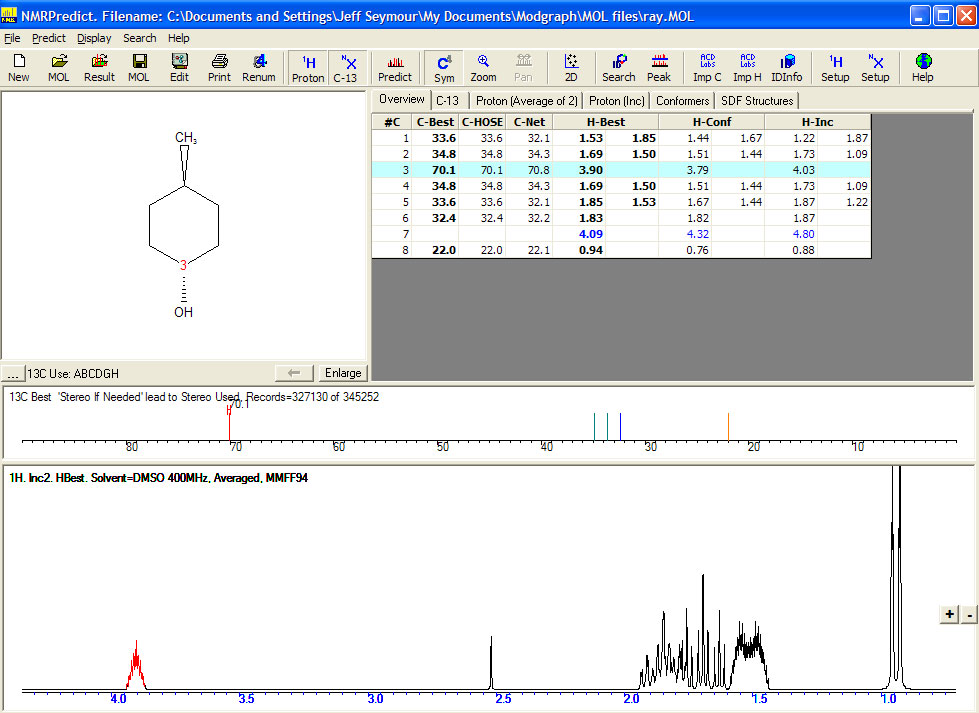
- Overview Tab. This displays a summary of both proton and carbon results
- #C – the atom number (as in the MOL file.)
- C-Best – the best shift value for the C13 prediction. This is based on the quality of prediction using the HOSE code and Neural Network technique. A sophisticated algorithm selects the "Best" value based on structural features and statistical parameters derived from the calculations
- C-HOSE – The HOSE code predicted value
- C-Net – The Neural Network predicted value
- H-Best – The Best proton predicted value taken from the conformer and increment values perhaps with a correction made based on training against 1,000,000 assigned shift values
- H-Conf – The proton prediction from the conformer method
- H-Inc – The proton prediction from the increment method
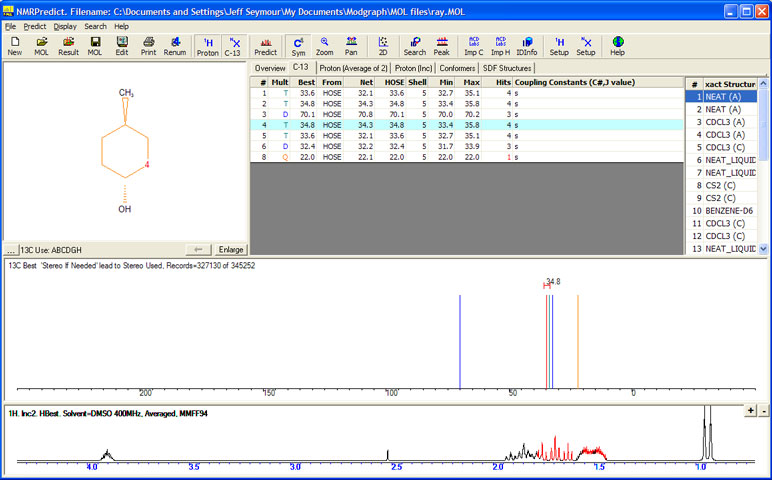
- C-13 Tab. Displays details of the carbon prediction.
- # - the carbon atom number
- Mult – the multiplicity. (SDTQ)
- Best – the best shift value. Either from the HOSE code or the Neural Network prediction
- From – where the best value came from, either from the HOSE code or the Neural Network prediction
- Net – the Neural Network shift results
- HOSE – the HOSE code shift results
- Shell – the maximum number of HOSE code shells reached
- Min – the minimum value from the database
- Max – the maximum value from the datbase
- Hits – the number of hits used in the database
- Coupling Constants – the C-X coupling constants (if available)
Double clicking on a row in the Carbon Grid drills down to the data behind the prediction.
A list of identical structures (if any) found in the database is also given. Clicking on the list displays the details.
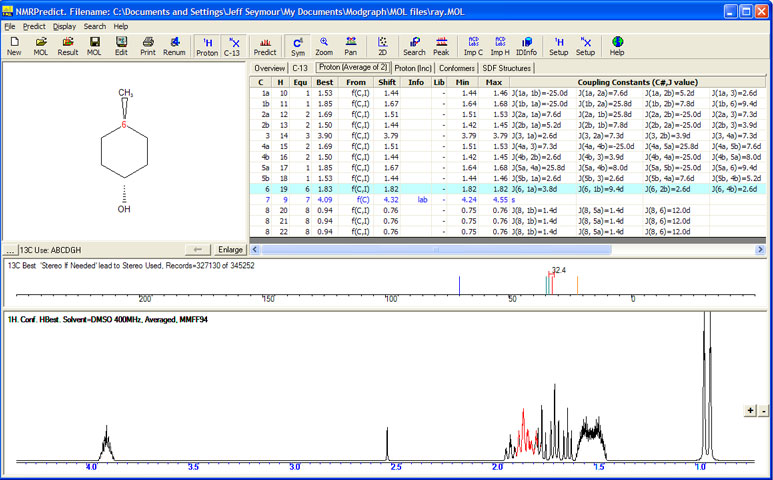
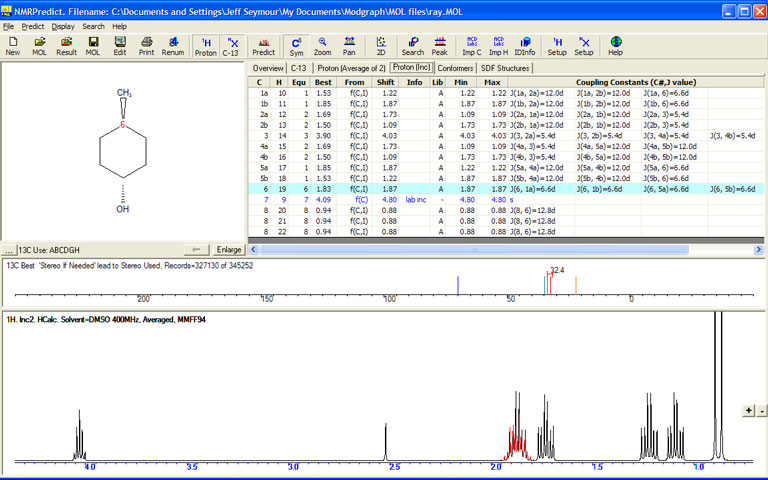
- Proton (Average)Tab. Displays the proton shifts and couplings from the conformer predictions.
- C – the heavy atom number
- H - the proton atom number
- Equ – the equivalence group which was assigned automatically
- Best – the best proton prediction value
- From – how the best proton prediction value was arrived at. f(C,I) means the value is a function of both the conformer and the increment methods, that the chemical environment has been seen in the 1,000,000 training set and that a correction factor has been applied. f(I) means that no correction was possible and the increment value is besing used
- Shift – the chemical shift for this proton from the conformer method
- Info – Error/ warning information. This includes:
- lab – Labile proton
- upg – Unparameterised group
- upa - Unparameterised atom
- qcf - Bad steric term, strained
- iva - Invalid atom, not parameterised
- ari - Arithmetic error
- Min – the minimum values from the conformers produced
- Max – the maximum values from the conformers produced
- Coupling constants (C#, J value) – the coupling constants for this proton calculated by the conformer method
- Proton (Inc)Tab. Displays the proton shifts and couplings from the increment predictions.
- C – the heavy atom number
- H - the proton atom number
- Equ – the equivalence group which was assigned automatically
- Best – the best proton prediction value
- From – how the best proton prediction value was arrived at. f(C,I) means the value is a function of both the conformer and the increment methods, that the chemical environment has been seen in the 1,000,000 training set and that a correction factor has been applied. f(I) means that no correction was possible and the increment value is besing used
- Shift – the chemical shift for this proton from the increment method
- Info – Error/ warning information. This includes:
- lab – Labile proton
- beta – Beta substituent missing
- alpha – alpha substituent missing
- inc – Increment missing
- nop – Sub-structure not recognised
- Lib – whether a library has been used to calculate the increment prediction value. "A" means the hand selected internal database has been used. If you create user databases (with the letters N-Z) these will show in this column
- Min – the minimum values from the conformers produced
- Max – the maximum values from the conformers produced
- Coupling constants (C#, J value) – the coupling constants for this proton calculated by the increment method
- Conformers Tab. Displays information about the conformer used to calculate the Proton spectrum.
- # - Conformer number
- Energy - the energy of the conformer
- Weight – the weighting used in the averaging process
- Calc – Yes/No was the conformer used in the calculation. Conformers are excluded on the basis of the ‘Max Energy Diff’ setting. This can be changed using the menu item Predict, Options, Proton Prediction Options
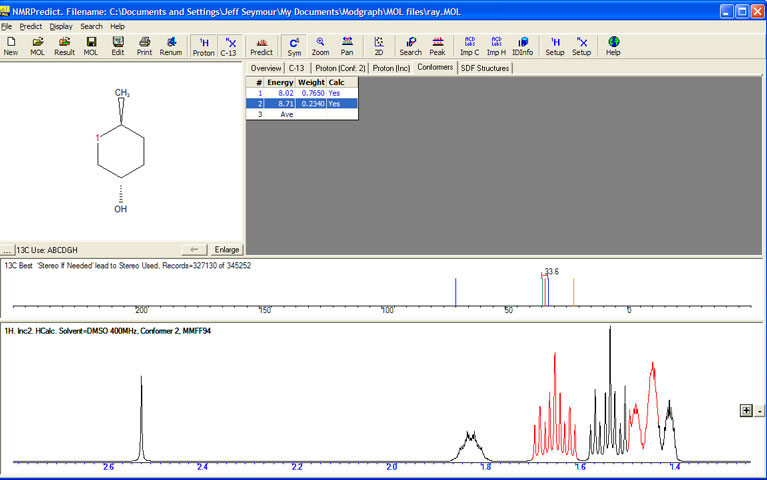
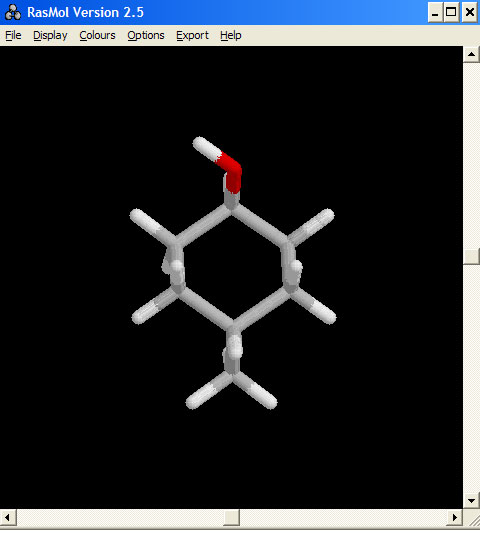
Double clicking on a row in the conformer table launches Rasmol (for users who have Isis Draw loaded) and shows each 3D conformer.. The spectrum changes as each confromer is chosen.